
Most training weeks don't go wrong because the total work was wrong. They go wrong because every day asked for almost the same thing, enough to make the athlete tired but not varied enough to adapt and recover. Training monotony and training strain, two load monitoring metrics from exercise physiologist Carl Foster, make that problem measurable. This guide explains how to calculate both, what a monotony score above 2.0 means, how they compare with the acute:chronic workload ratio (ACWR), and how to read the Monotony & Strain chart on Coachable's Program Stats page when you plan your next Olympic weightlifting block.
Quick Takeaways
| Key Insight | Explanation |
|---|---|
| Load is the amount | Weekly load is the total work done across the 7 days of a week. |
| Monotony is the sameness | Higher monotony means the daily loads were more alike. |
| Strain is load × monotony | High strain means the week was both heavy and repetitive. |
| 2.0 is a warning, not a verdict | Monotony above 2.0 is the commonly cited risk marker from Foster's research. Treat it as a reason to look closer. |
| Compare an athlete to themselves | Strain values depend on the load metric, so compare weeks for the same athlete, never across athletes. |
| Fix the distribution first | You can usually lower monotony by spreading the same work less evenly, without cutting volume. |
How to calculate training monotony and strain
Weekly load
Weekly load is the sum of the 7 daily loads, with rest days counted as 0.
Foster's original method uses session RPE (rating of perceived exertion × session minutes) as the daily load. Coachable uses the load metric you pick on the Program Stats page instead: total reps, total volume, or intensity-based load (average intensity × intensity reps). The formulas are the same either way.
Training monotony formula
Monotony = mean daily load ÷ standard deviation of daily load over the 7 days of the week.
When daily loads vary a lot, the standard deviation is large and monotony stays low. When every day looks nearly identical, the standard deviation shrinks and monotony climbs. Monotony has no units. It describes the shape of the week, not its size.
If the daily loads never vary at all, the standard deviation is 0 and monotony can't be calculated. Coachable shows that as a gap in the line, the same gap you see when a week has no data.
Training strain formula
Strain = weekly load × monotony, in arbitrary units (AU).
Because monotony multiplies the load, a moderate week done the same way every day can produce more strain than a heavier week with clear hard and easy days. The metric penalizes repetition, not just volume.
Coachable's load is based on reps, volume, or intensity rather than session RPE, so strain values here won't match the numbers in research papers. Compare weeks and blocks for the same athlete, on the same load setting.
A worked example: same work, different cost
Here are two weeks with the same 300 units of weekly load.
| Day | 1 | 2 | 3 | 4 | 5 | 6 | 7 |
|---|---|---|---|---|---|---|---|
| Week A: 3 training days | 100 | 0 | 100 | 0 | 100 | 0 | 0 |
| Week B: 7 similar days | 50 | 40 | 50 | 40 | 50 | 40 | 30 |
Week A
- Weekly load: 300
- Monotony: 0.87
- Strain: 260 AU
Week B
- Weekly load: 300
- Monotony: 6.12
- Strain: 1,837 AU
Week A stays well under 1.0 because it has clear on and off days. Week B spreads the same work across every day with very little difference between them, so monotony and strain are about seven times higher. The total work is identical, but the cost to the athlete is not.
What is a good training monotony score?
Foster's research linked high monotony, combined with high strain, to a higher rate of illness and poor performance in athletes. A monotony value above 2.0 is the threshold most coaches and sports scientists use as a warning line.
There is no perfect score. Very low monotony usually means a well designed week with heavy, medium, and light days. It can also mean chaotic loading, where missed sessions pushed work into the days that were left. Always check what happened in the actual week before you read anything into the number.
Monotony and strain vs ACWR
Monotony, strain, and the acute:chronic workload ratio all come from the same daily load data, but they answer different questions.
- ACWR compares this week's load with the average of the last several weeks. It tells you whether load is rising faster than the athlete is used to.
- Monotony looks inside a single week. It tells you whether the days were varied enough to recover between.
- Strain combines the size of the week with its monotony. It tells you whether a heavy week was also a repetitive one.
A week can have a safe ACWR and still be monotonous, for example when the total load is normal but every day is the same. Reading the metrics together gives you a fuller picture than any one of them alone. In Coachable, ACWR shows in the program editor's stats while you write, and monotony and strain show on the Program Stats page.
How to read the Monotony & Strain chart in Coachable
Open a program and go to the Program Stats page. The Monotony & Strain chart shows weekly strain as bars and weekly monotony as lines. The info icon next to the chart title links to this article.
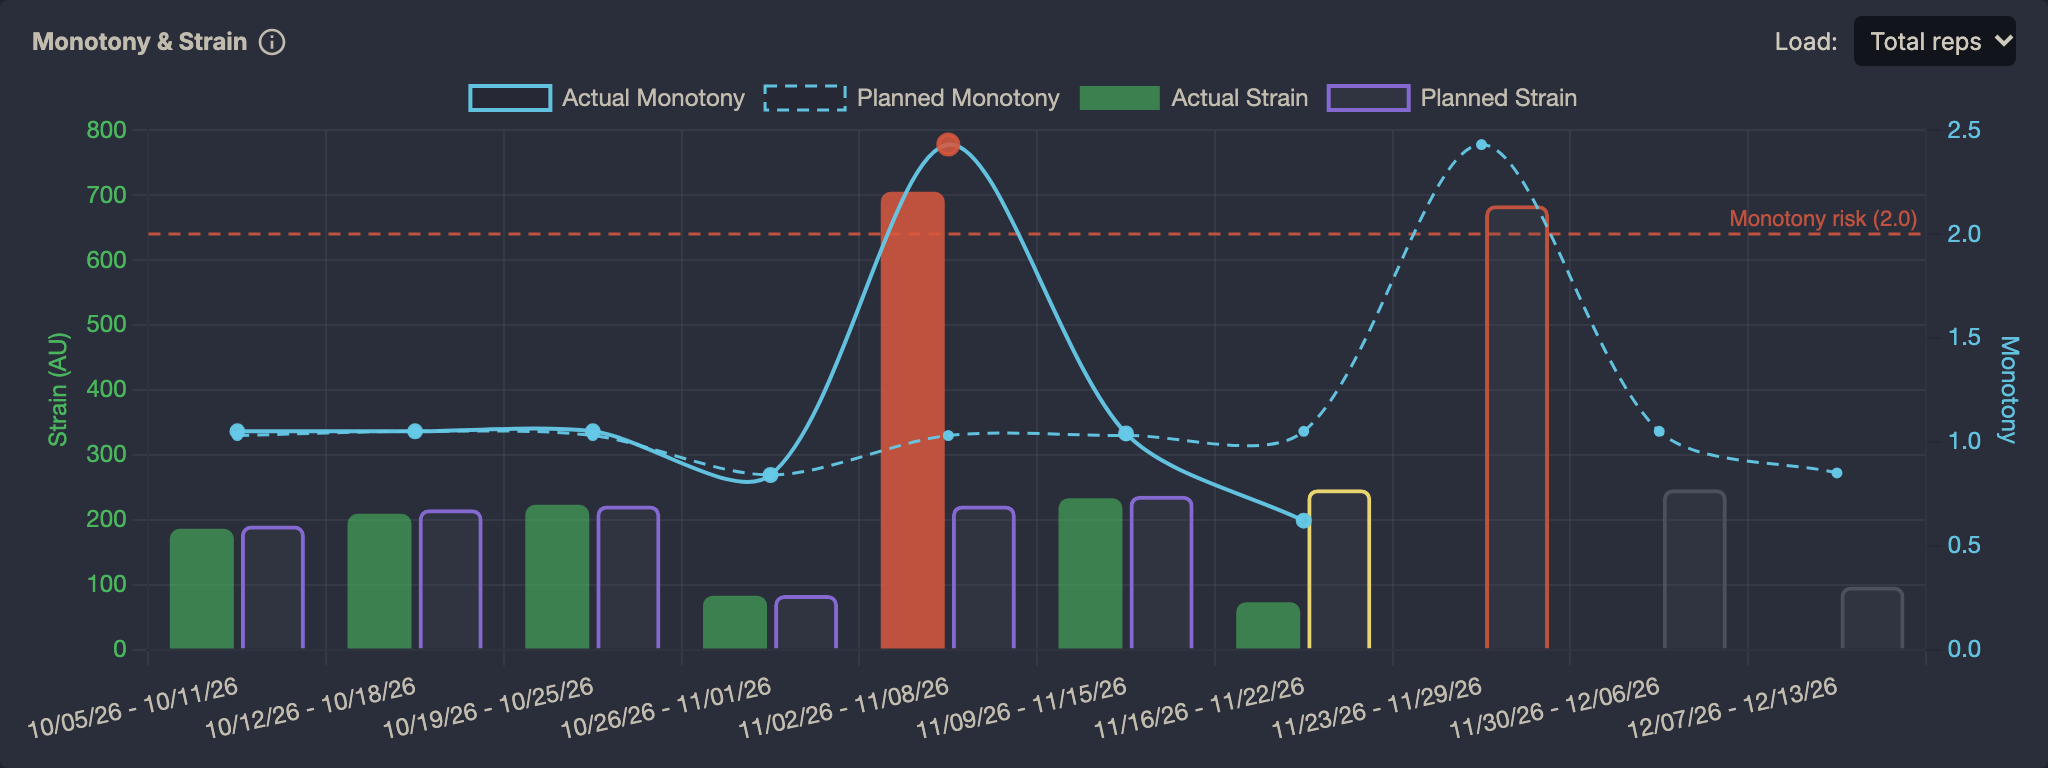
- Bars show strain, on the left axis. Green bars are actual strain from logged training. Outlined bars are planned strain.
- Planned bar borders show timing. Purple is a past week, yellow is the current week, and grey is a future week. A planned week that is flagged gets a red border.
- Blue lines show monotony, on the right axis. The solid line is actual monotony and the dashed line is planned monotony.
- The dashed red line marks 2.0, labeled "Monotony risk (2.0)".
- The Load selector switches between total reps, total volume, and intensity-based load.
- Week labels change by screen size. Desktop shows date ranges. Mobile shows Week 1, Week 2, and so on.
Hover over a week to see a tooltip with planned and actual load, monotony, and strain. Click a week to jump to it.
The planned vs actual split is the most useful part of the chart. If planned monotony was high, the program created the problem. If the plan was fine but actual monotony climbed, something changed in how the week was trained.
What a red flagged week means
A week is flagged only when monotony is above 2.0 and strain is above that program's average strain. Flagged actual bars turn red, flagged monotony points turn red and larger, and the tooltip adds a warning line.
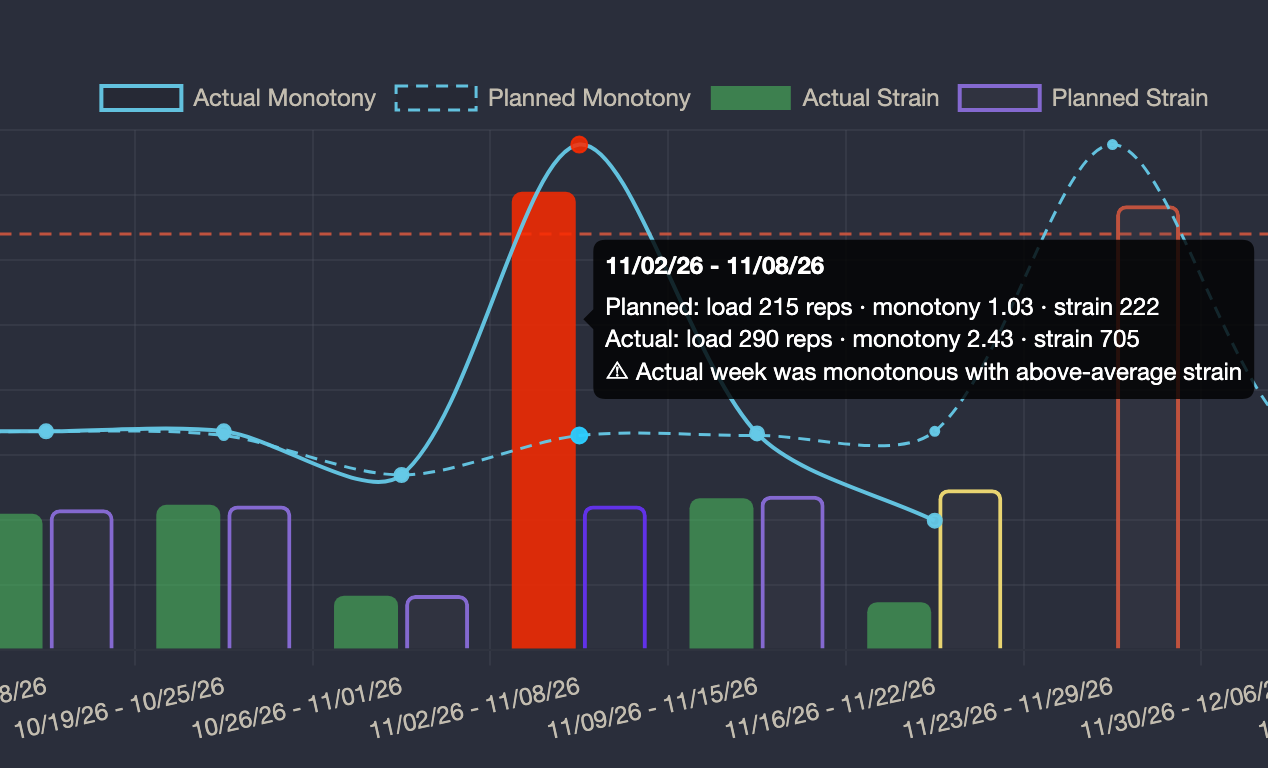
In the week above, the plan had clear heavy and light days with a monotony of 1.03. The athlete trained six similar days instead, pushing actual monotony to 2.43 and strain to more than three times the planned value.
Treat a flag as a prompt to look, not a diagnosis. Before you change anything, find out what drove it. Were the planned sessions too similar, or did the athlete compress the week and stack similar days together?
The chart does not predict injury. A flag means the week combined high repetition with higher than usual strain for that athlete, which is worth checking before the pattern repeats.
Check the plan before the block starts
The dashed planned monotony line lets you audit a training block while changes are still cheap to make.
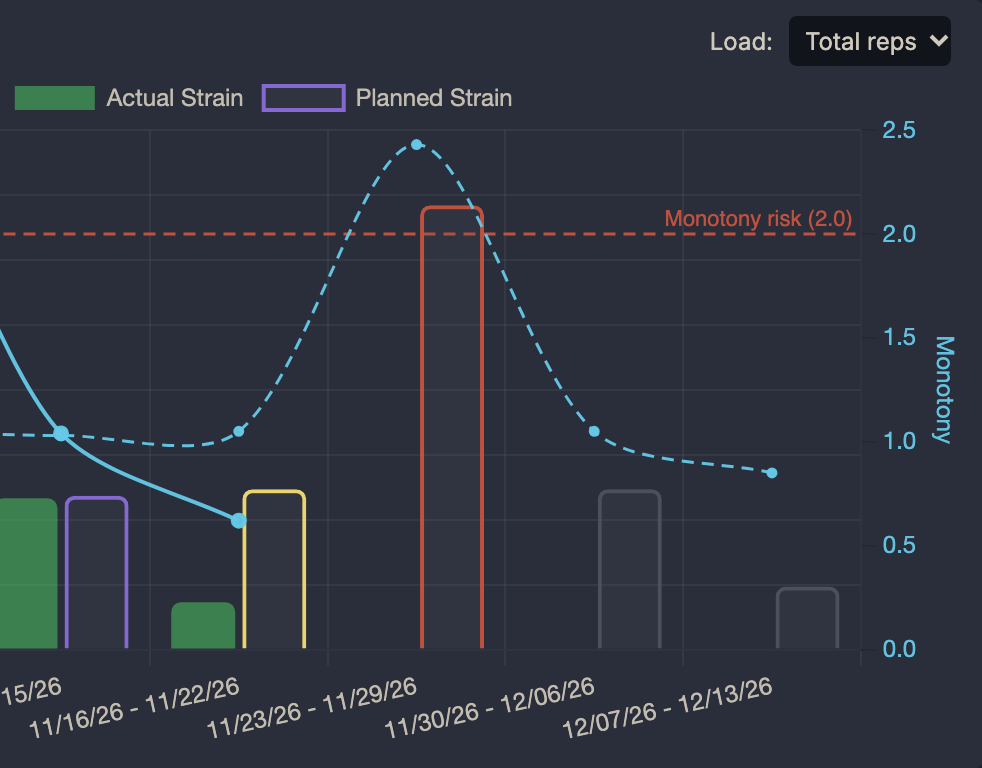
If planned monotony for an upcoming week is already over 2.0, rearrange it before the athlete starts. Change the daily distribution first. You often don't need less total work, just the same work spread less evenly across the week.
How to use monotony and strain in your programming
Build variation in. Program heavy, medium, and light days instead of near identical sessions, so the daily loads don't all land in the same place.
Use strain to compare blocks for the same athlete. A rising trend across a hard accumulation block is expected. A sudden spike against the program average is the signal to look for. Deload weeks should show strain dropping. If they don't, the deload isn't working as one.
Don't chase the lowest number. Low monotony can mean a well designed week or a chaotic one. Check the actual week.
Read planned vs actual at every review. A monotonous plan needs a rewrite. A good plan trained monotonously needs a conversation with the athlete about scheduling or adherence. The chart tells you which problem you have.
Use it as one lens, not a verdict. Pair it with ACWR in the program editor and the other Program Stats charts, including INOL and missed reps. You still make the call on fatigue, technique, and readiness.
A one minute weekly check
- Is planned monotony for next week under 2.0?
- Did actual strain spike against this program's recent weeks?
- If a week was flagged, can you name what drove it before changing anything?
Frequently asked questions
What is training monotony?
Training monotony is a measure of how similar an athlete's daily training loads are across a week. It is calculated as the mean daily load divided by the standard deviation of daily load. Higher values mean less day to day variation.
What is training strain?
Training strain is weekly training load multiplied by monotony. It rises when a week is both heavy and repetitive, and it is reported in arbitrary units (AU).
What monotony score is too high?
A monotony value above 2.0 is the commonly used warning threshold from Carl Foster's research. It is most meaningful when strain is also higher than usual for that athlete.
Do rest days count in monotony?
Yes. Rest days count as a daily load of 0. Including them is what lets a week with clear training and rest days show low monotony.
Can I compare strain between athletes?
No. Strain depends on the load metric and on each athlete's normal training, so compare it only across weeks for the same athlete using the same load setting.
Try it on your own programs
Coachable calculates monotony and strain automatically from the programs you already write, with planned and actual side by side. It is free for up to 15 athletes. If you're still planning in spreadsheets, see why remote weightlifting coaches are dropping spreadsheets.
References
- Foster C. Monitoring training in athletes with reference to overtraining syndrome. Medicine & Science in Sports & Exercise. 1998;30(7):1164–1168.
- Foster C, Florhaug JA, Franklin J, et al. A new approach to monitoring exercise training. Journal of Strength and Conditioning Research. 2001;15(1):109–115.